TABLE OF CONTENTS
Introduction to Store view across Products
This article will demonstrate how to use the Store View across Products in the Forecast tab.
Overview
This feature allows a user to understand sales behaviour and forecast predictions across a store or group of stores for a Product or Product Group.
For example, as a demand planner you may want to see demand for a selected number of stores, see which stores have the greatest or least need for a product or group of products, and then adjust the forecast across one to many stores for that product or product category.
The Store View of forecasts lets you manage the above use case efficiently.
How to access the Store view of Forecasts
To access the Store view - go the advanced option grid and click; "Show Store View". The table will display all the stores selected in the regions in the dropdown. If no selection has been made, all stores will be displayed.
The products selected can be viewed and compared across all selected stores.
Add or remove Stores using the Store picker on the top right hand side, above the Forecast Grid.
Open the Advanced options menu to enable a different view of the selected products.
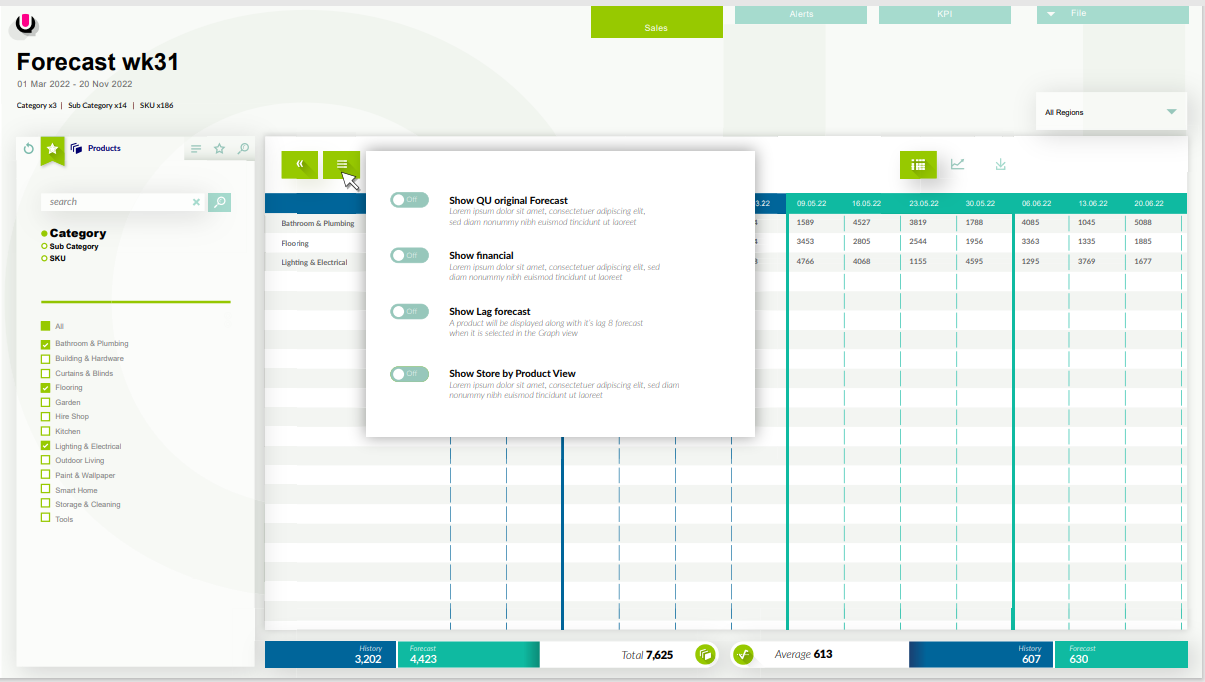
An aggregation of every product type selected in the filter will be displayed on the table as sold by the stores listed.

Navigating but making no product change will instigate no difference in the table view.
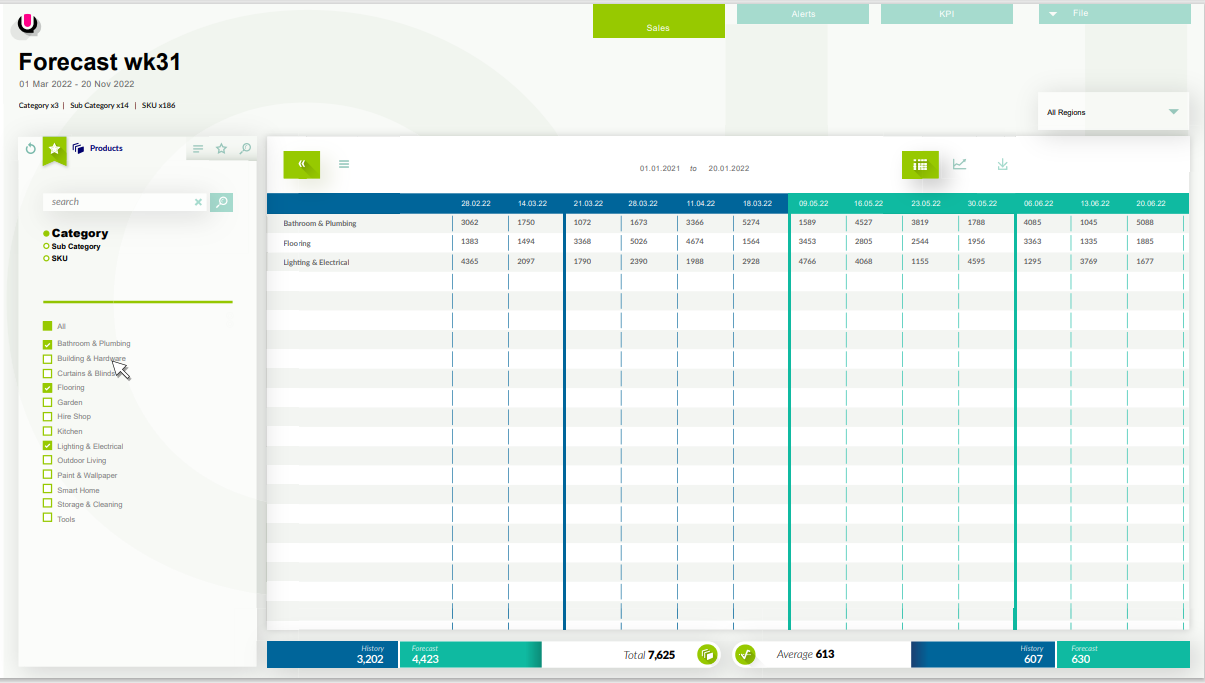
As refinements are made to the product selection in the product filter, the table reflects the number of units forecast by the stores they are being sold in.
The demand planners can now refine the view of the stores they are working with. The region/store selector enables groups of stores, individual stores or individual stores in multiple regions to be selected.

Sales vs Forecast
Below are all the products at the category level selected in the filter and displayed in the table. The tables show historical data in blue, QU and locked forecast numbers in the green-headed columns.

The selection is narrowed by deselecting items in the filter.
Was this article helpful?
That’s Great!
Thank you for your feedback
Sorry! We couldn't be helpful
Thank you for your feedback
Feedback sent
We appreciate your effort and will try to fix the article